A summary of draw options for selection data.
1.0 Introduction
Insights offers the ability to draw custom boundaries for selecting data to process.
2.0 Selecting a Draw option
Follow these steps to draw a custom boundary for data selection starting from the initial report criteria dialogue box in Insights:

Step 1 - Set Location Criteria to Draw

- Draw: Selecting "Draw" will enable you to select your data by using one of the draw options available.
![]()
- Workspace Geography: If you have multiple geographies setup in your account a dropdown is available to select between them. For most accounts, only one boundary is setup and will be selected by default.
Step 2 - Set Report Type

You have the option to select whether you want to generate an aggregated or daily report.
- Aggregated Report: An aggregated report averages the data across the selected time period to output a representative week of data, but you cannot review a specific date.
- Daily Report: A daily report will process individual daily data for the selected time period enabling you to review a specific date of data.
Step 3 - Select Your Draw Option
Choose how you would like to draw your boundary. There are four draw options available including:
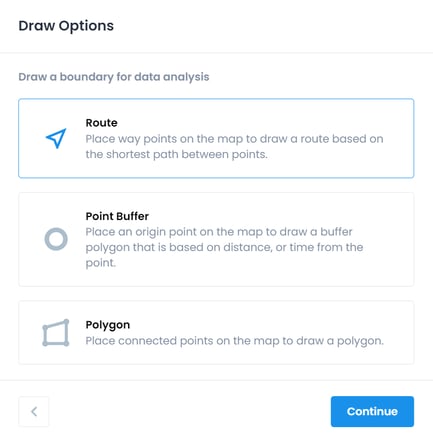
- Route: ability to select an aggregated set of road segments by placing way points on the map and select the links in between based on the shortest path.
- Point Buffer: ability to generate a buffer by placing a point and setting a distance from the point.
- Time Buffer: ability to generate a buffer by placing a point and setting a travel time from the point.
- Polygon: ability to draw a polygon by placing connected points on the map.
Click "Next" to proceed to drawing.
Step 4 - Draw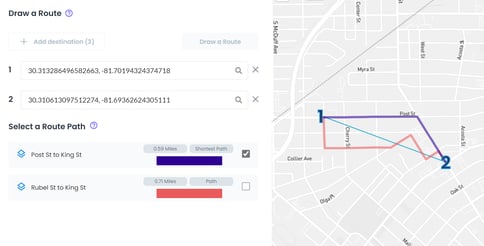
- Drawing a Route: Search for an address, or simply click on the map to place a point. Only two points are needed to generate a path, but you are able to place up to 5 points to inform the design of your route. Once you are satisfied with your point placements, click "Build Route" and up to 4 shortest path route alternatives will be generated.

- Drawing a Point Buffer: Search for an address, or simply click on the map to place a point. Once a point is placed you can click on it again to expand the point. Once expanded, you can hold and drag it to draw a circular buffer around the point. Alternatively, you can use the blue slider in the left panel to adjust the buffer size.

- Drawing a Time Buffer: Search for an address, or simply click on the map to place a point. Once a point is placed you can choose what mode of travel you want to use for generating the time buffer in the "Travel Selection" dropdown, and then set a travel time in minutes and click "simulate" to generate the buffer.
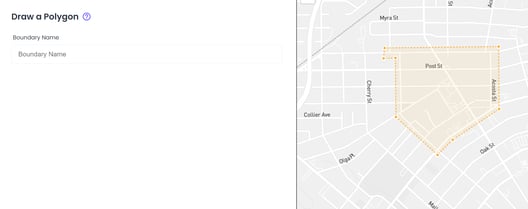
- Drawing a Polygon: Place connected points on the map by click on the map. To complete the polygon, click on the starting point. You can click on the generate polygon to go into edit mode where you can select the individual points and adjust their position, add new points, or delete them.
Step 5 - Set Name & Build Report

- Set a report name to be able to build a report. There is an optional field to put a report description as well.
Click "Build Report" to submit for processing. You will get the option to stay and wait for the report to be completed (usually <10 minutes), or you can build another report for processing while you wait. In both instances, an email notification will be sent to notify you when your report is processed.
